Known issue:
- When Prometheus is deployed in a cluster, the state displays as Unknown even when the add-on is running.
Prometheus natively monitors kubernetes, nodes, and prometheus itself. The Prometheus Operator simplifies Prometheus setup on Kubernetes, and allows you to serve custom metrics API using the Prometheus adapter. Prometheus provides a robust query language and a built-in dashboard for querying and visualizing your data. When deployed via Nirmata, Prometheus is supported by Grafana for creating dashboard views of Prometheus data.
Kubernetes cluster monitoring via Prometheus tracks overall cluster CPU, memory, and/or file system usage in addition to individual pod, containers, and system services statistics using Custom Resource Definitions.
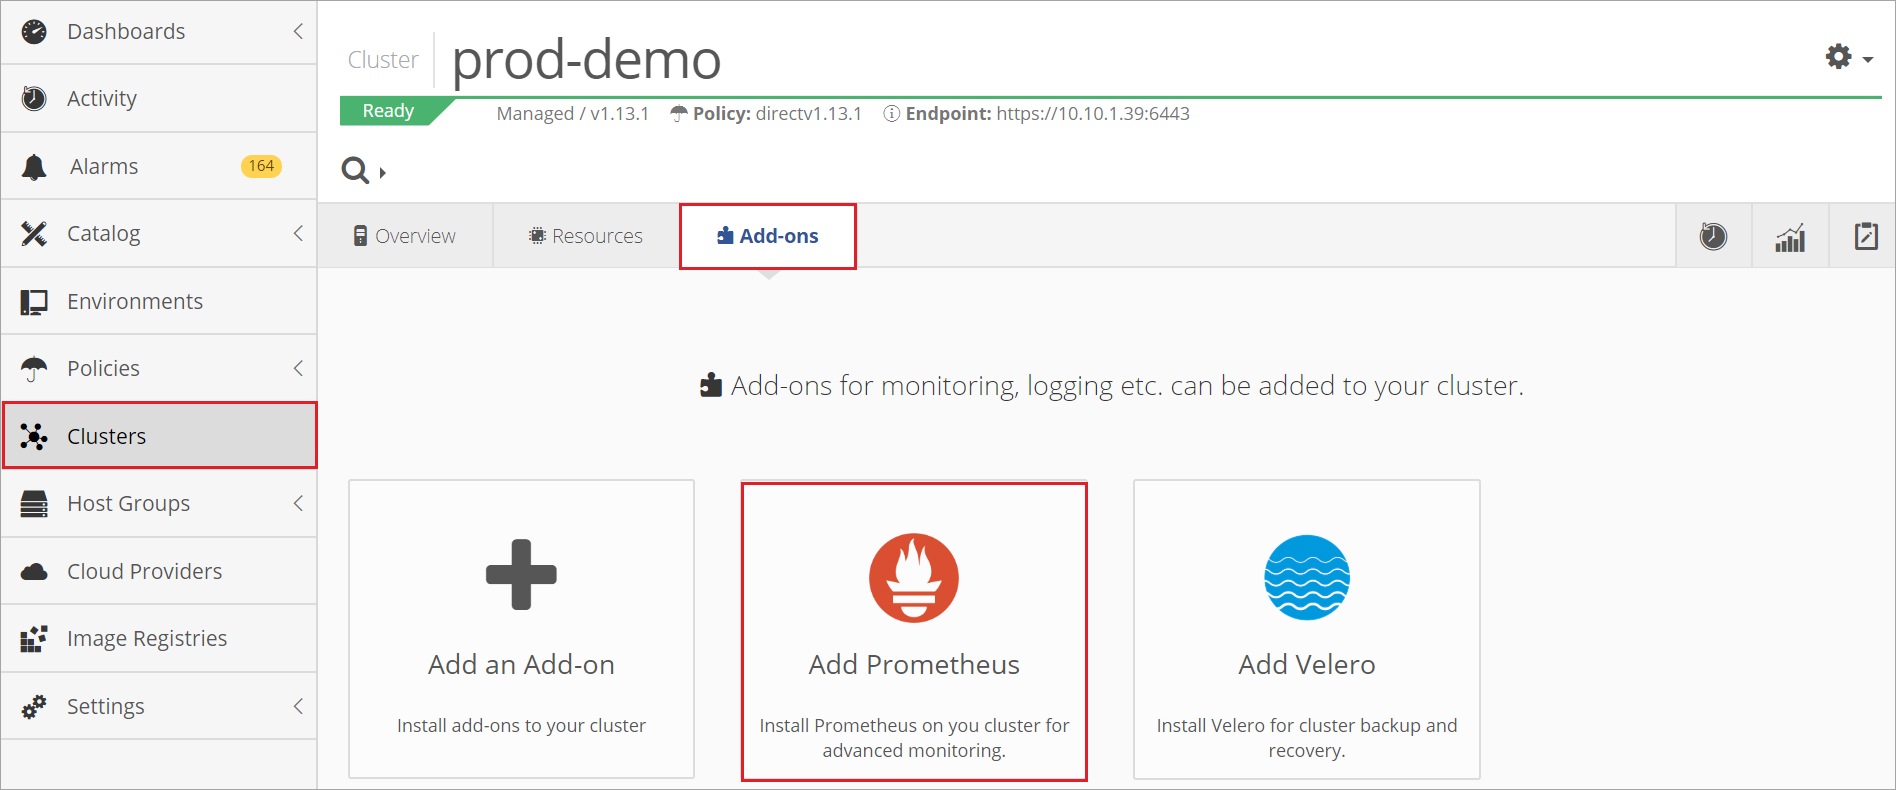
To add a Prometheus monitoring to a cluster, click Add-ons from within the cluster and then select Add Prometheus.
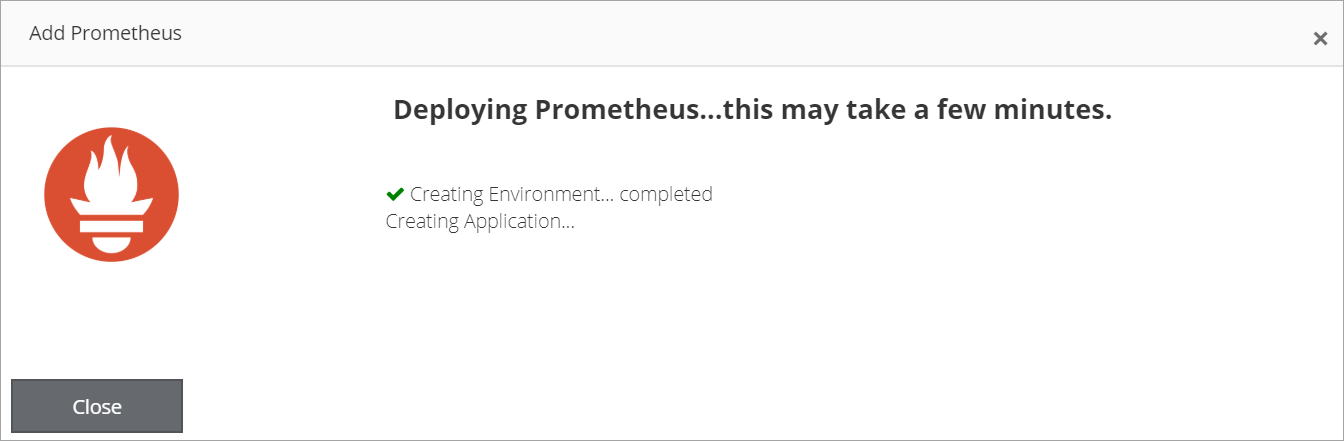
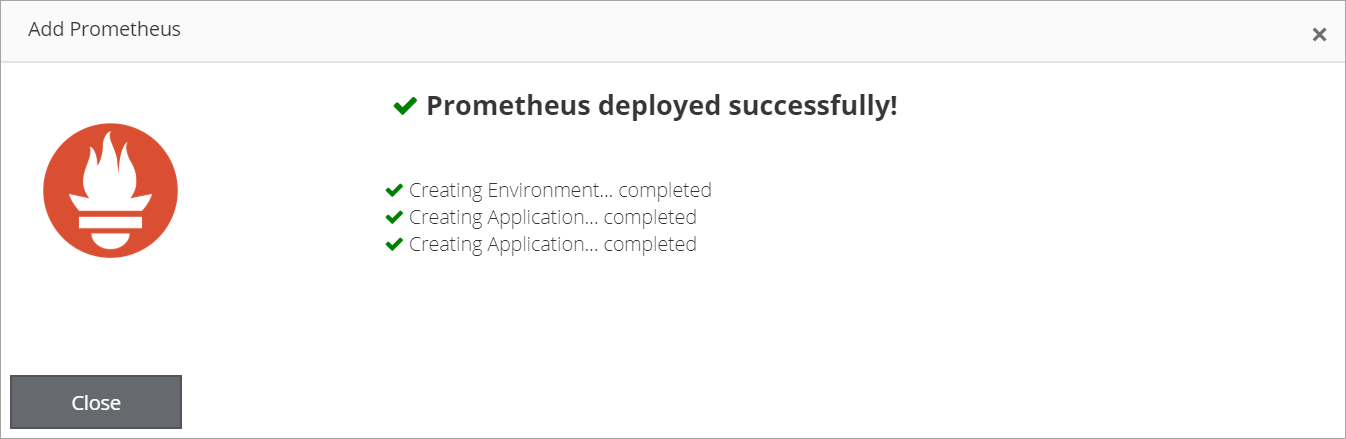
To deploy, an environment called nirmata-monitoring-[ClusterName] is created. The Prometheus operator [prometheus-operator] deploys inside the new environment and the Prometheus adaptor [prometheus] runs as a separate application within the environment. To add Prometheus to an existing account, create a Prometheus add-on in the Nirmata Catalog and then deploy it in an Environment. To test that Prometheus has deployed on the cluster, verify that Grafana is listed in Services.
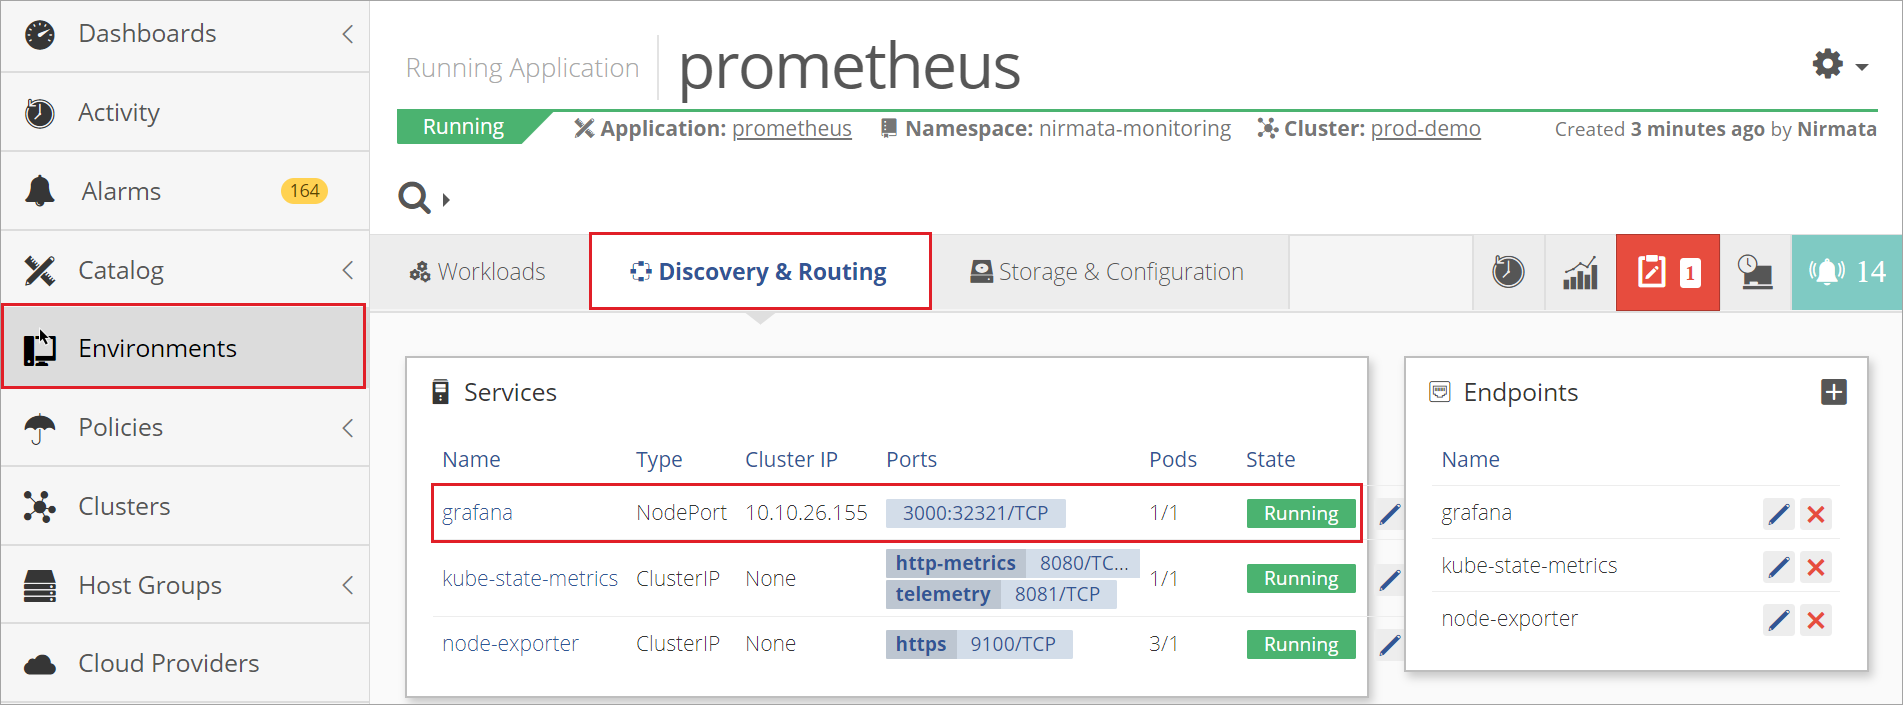
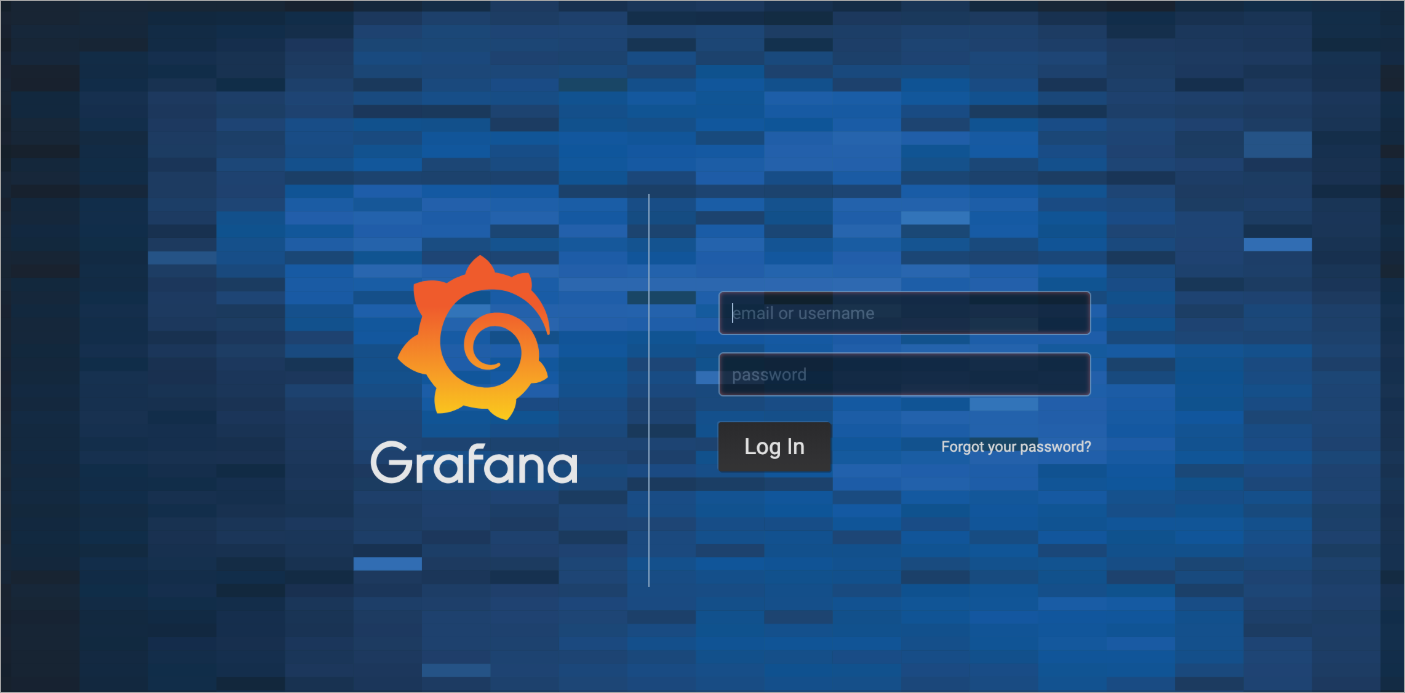
Then, open the cluster and the Grafana service. Enter Grafana login credentials:
User name: admin
Password: admin
You will be immediately prompted to change your password.
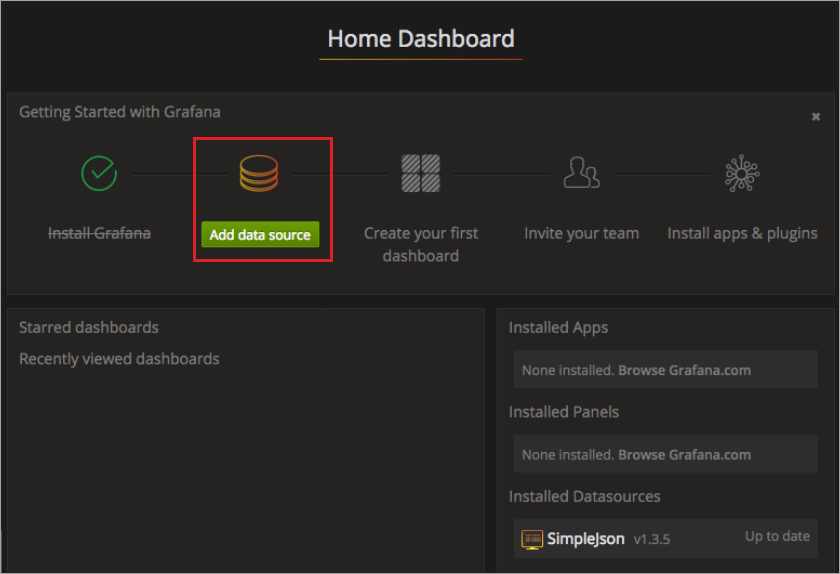
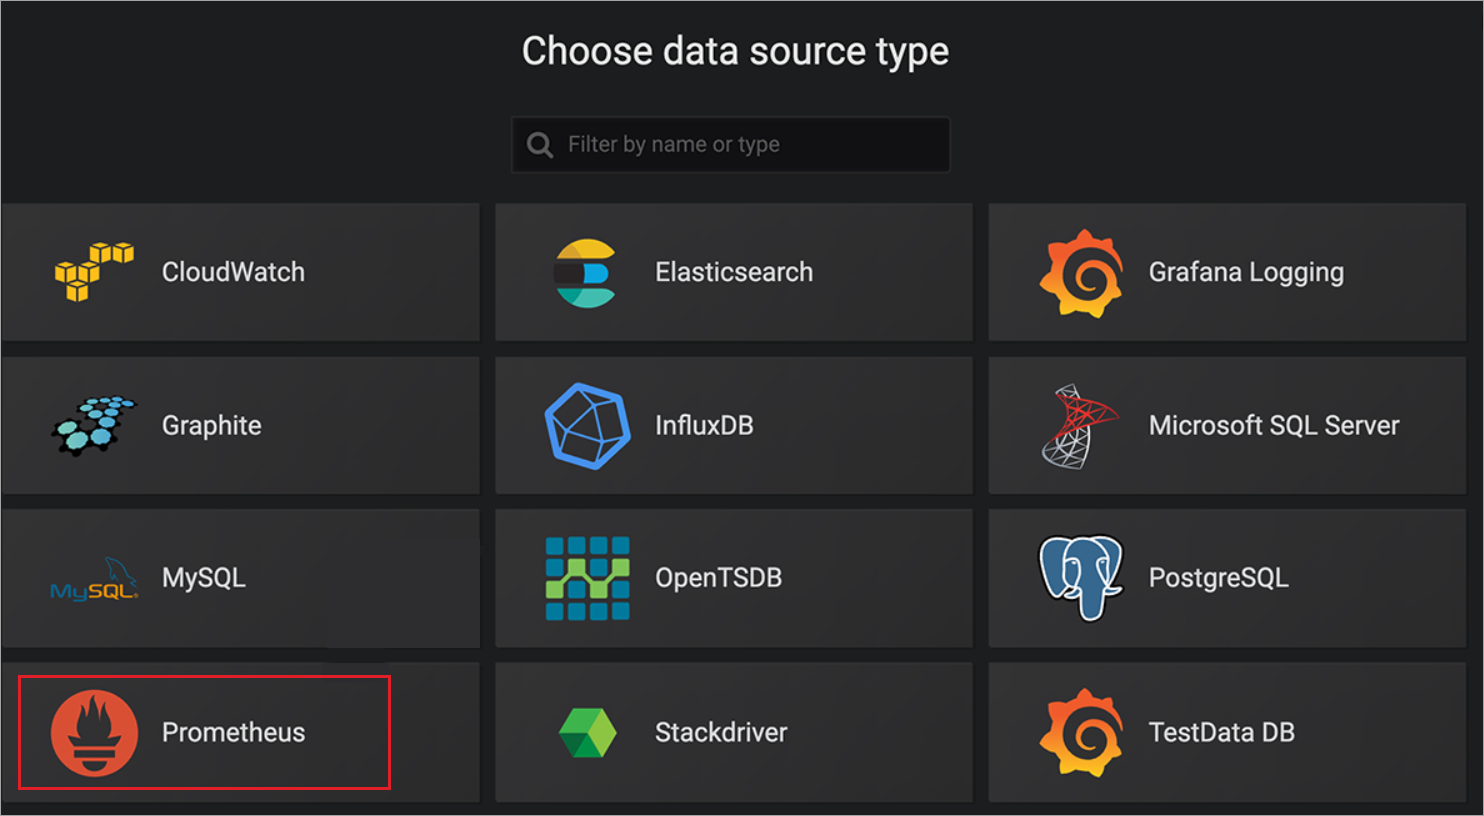
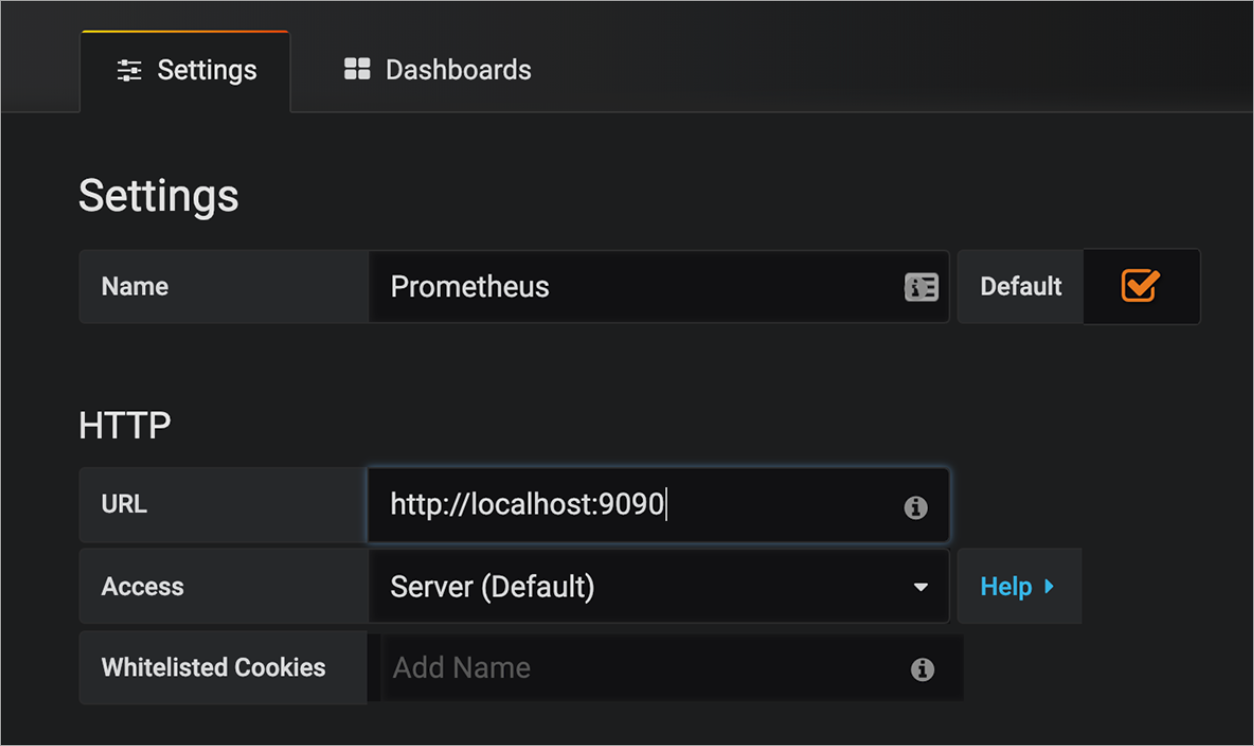
Select Add a data source and choose Prometheus.
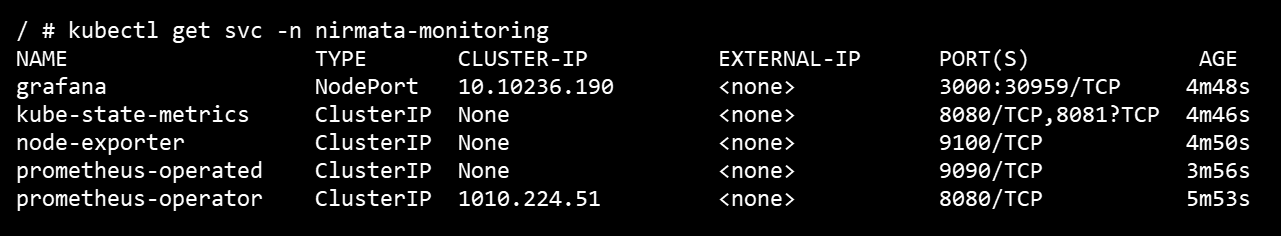
In the URL field, enter the port in which Prometheus is deployed. To locate the node port, retrieve the cluster services by entering Cluster Service Retrieval command in a command prompt.
Cluster Service Retrieval Command:
/ # kubectl get svc –n nirmata-monitoring
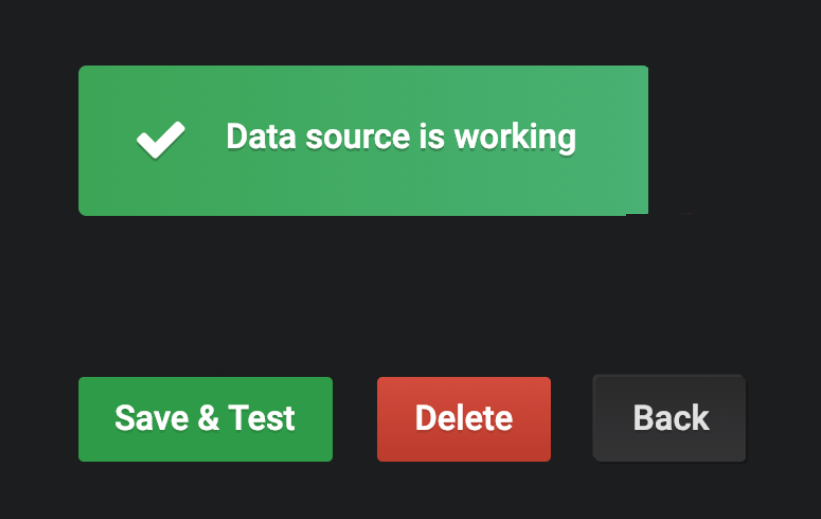
After entering the URL, click Save & Test.
Grafana will confirm that the Datasource is updated and Data source is working.
After deploying Grafana in the cluster, create dashboard in Grafana to monitor the cluster.
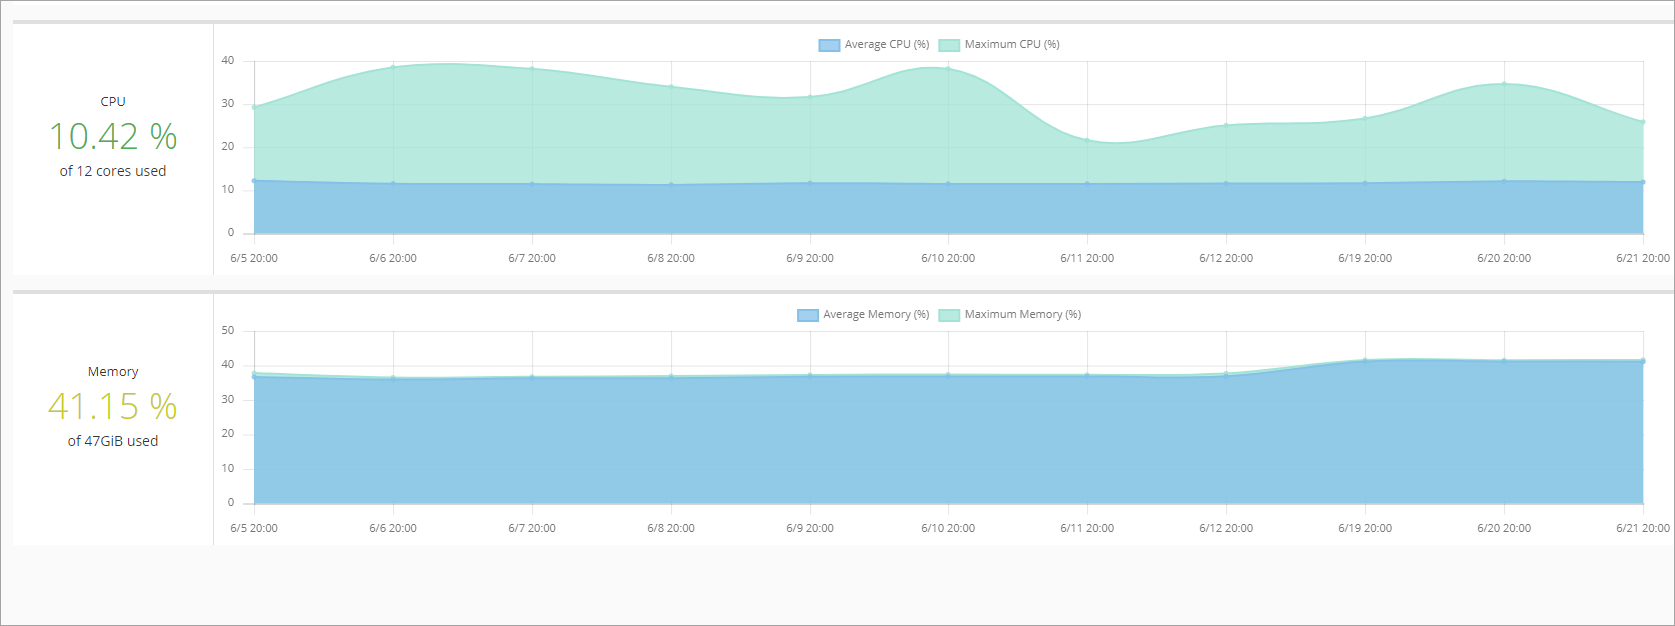
To view Prometheus metrics in Nirmata, select the cluster and then click on the analytics button.
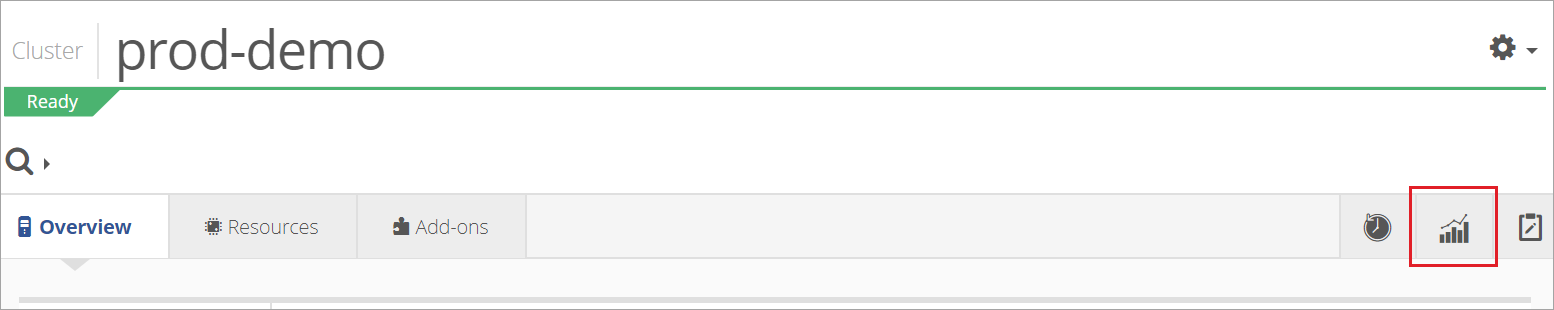
Prometheus metrics displays in real-time.