Nirmata v2.1.0 requires configuration changes to the operator.yaml file.
Note: The full YAML file is available here: operator.yaml
Modify the Following Parameters in operator.yaml
Allow use of extensions in place of apps.
apiVersion: extension/v1beta1
`kind: Deployment
Configure a flex-volume path for ceph volume-plugins.
- name: FLEXVOLUME_DIR_PATH
value: "/opt/nirmata/volume-plugins/"
When changes are complete, apply operator.yaml to the cluster.
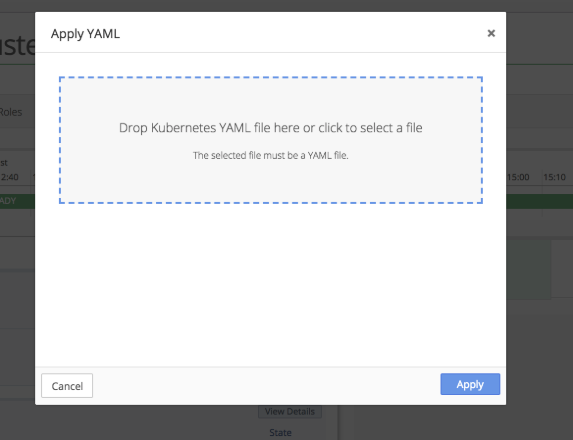
Click the gear in the top right corner of the Cluster window to open the Cluster Settings menu. Then select Apply YAML.

Drop the operator.yaml file into the upload box or select the file from the directory.
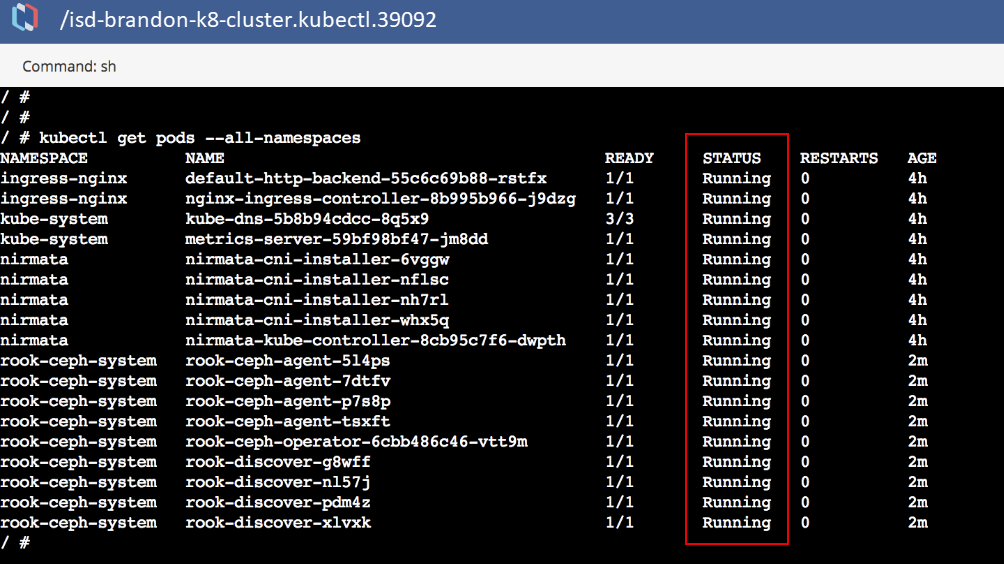
From the Cluster Settings menu, select Launch Terminal to run a Kubectl command to verify that the operator, discover, and agent pods are up and running.

If properly configured, the Kubectl command will report that all pods are running.

Configure and Deploy cluster.yaml
To deploy the cluster in Nirmata, modify cluster.yaml. The modified cluster.yaml installs in the roo-ceph namespace.
All applications in Nirmata are deployed in an Environment.
At the application isolation level, the namespace is: applicationname-environmentname
A shared namespace within an environment is: environmentname
In this example, cluster.yaml is deployed as an application in a rook-ceph environment.
To start, create a �rook-ceph� environment with a shared namespace at the application isolation level.
Click +Add Environment and then complete the information in the pop-up window and click Add.

The new rook-ceph environment appears in the Environments menu.

Next, create a new a �rook-cluster� application in the Application Catalog.
To create a new application, click on Catalog in the sidebar menu and then select Application Catalog. From the main Application Catalog screen, click Add Application.
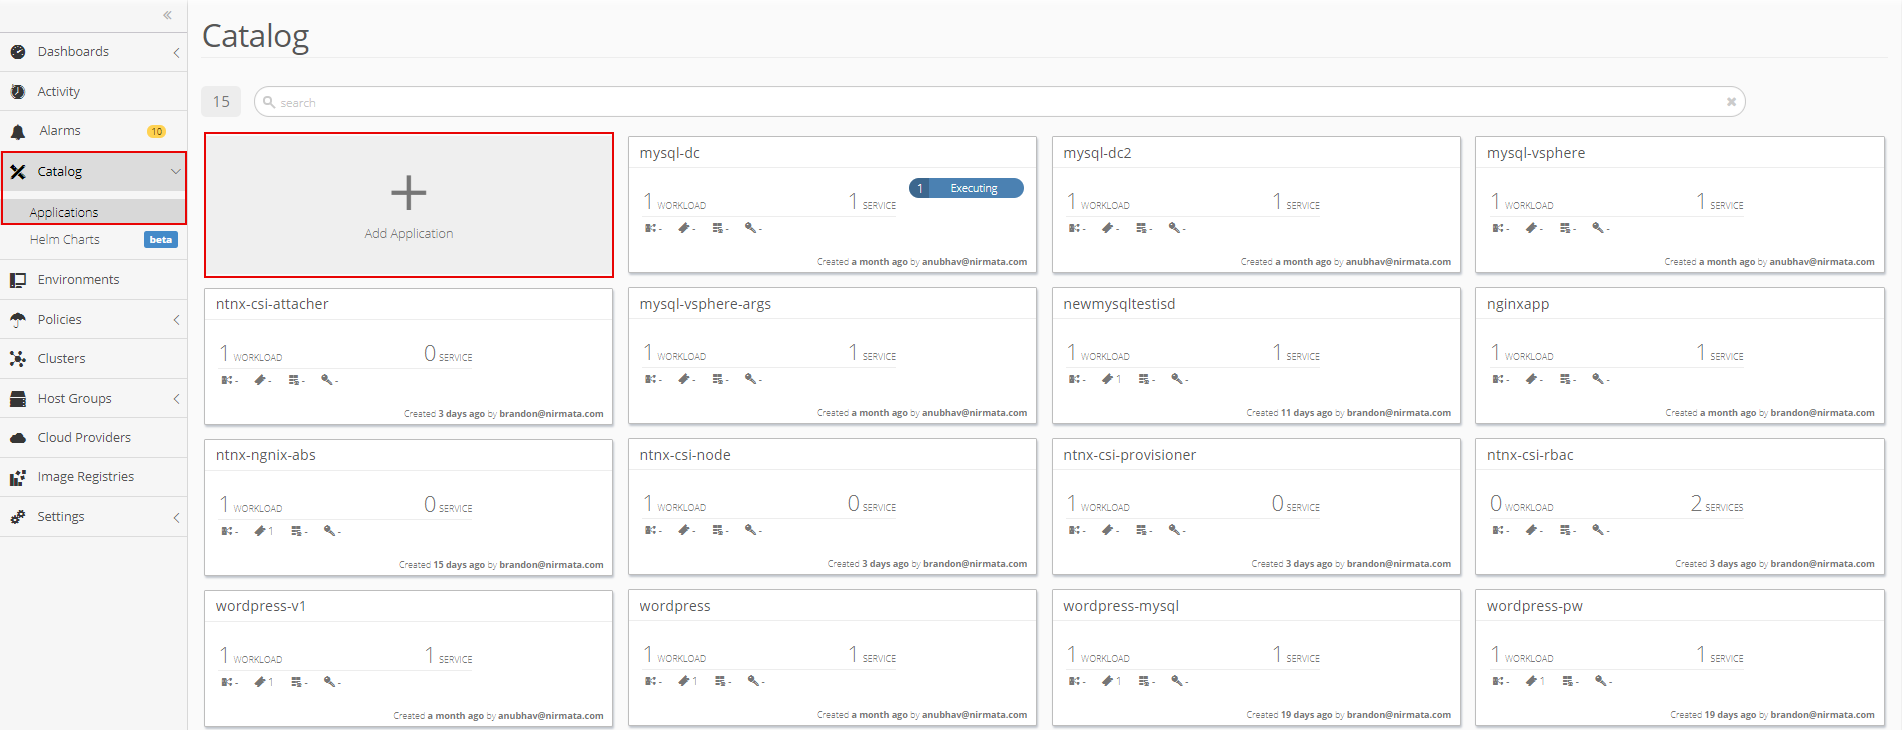
Add the following YAML file to create the rook-cluster application:
apiVersion: ceph.rook.io/v1beta1
kind: Cluster
metadata:
  name: rook-ceph
spec:
  dataDirHostPath: /var/lib/rook
  # The service account under which to run the daemon pods in this cluster if the default account is not sufficient (OSDs)
  serviceAccount: rook-ceph-cluster
  # set the amount of mons to be started
  mon:
    count: 3
    allowMultiplePerNode: true
  # enable the ceph dashboard for viewing cluster status
  dashboard:
    enabled: true
  network:
    # toggle to use hostNetwork
    hostNetwork: false
# The requests and limits set here, allow the mgr pod to use half of one CPU core and 1 gigabyte of memory
#    mgr:
#      limits:
#        cpu: "500m"
#        memory: "1024Mi"
#      requests:
#        cpu: "500m"
#        memory: "1024Mi"
# The above example requests/limits can also be added to the mon and osd components
#    mon:
#    osd:
  storage: # cluster level storage configuration and selection
    useAllNodes: true
    useAllDevices: false
    deviceFilter:
    location:
    config:
      # The default and recommended storeType is dynamically set to bluestore for devices and filestore for directories.
      # Set the storeType explicitly only if it is required not to use the default.
      # storeType: bluestore
      databaseSizeMB: "1024" # this value can be removed for environments with normal sized disks (100 GB or larger)
      journalSizeMB: "1024"  # this value can be removed for environments with normal sized disks (20 GB or larger)
# Cluster level list of directories to use for storage. These values will be set for all nodes that have no `directories` set.
#    directories:
#    - path: /rook/storage-dir
# Individual nodes and their config can be specified as well, but 'useAllNodes' above must be set to false. Then, only the named
# nodes below will be used as storage resources.  Each node's 'name' field should match their 'kubernetes.io/hostname' label.
#    nodes:
#    - name: "172.17.4.101"
#      directories: # specific directories to use for storage can be specified for each node
#      - path: "/rook/storage-dir"
#      resources:
#        limits:
#          cpu: "500m"
#          memory: "1024Mi"
#        requests:
#          cpu: "500m"
#          memory: "1024Mi"
#    - name: "172.17.4.201"
#      devices: # specific devices to use for storage can be specified for each node
#      - name: "sdb"
#      - name: "sdc"
#      config: # configuration can be specified at the node level which overrides the cluster level config
#        storeType: filestore
#    - name: "172.17.4.301"
#      deviceFilter: "^sd."
Run the cluster application in a rook-ceph environment and apply role-binding.
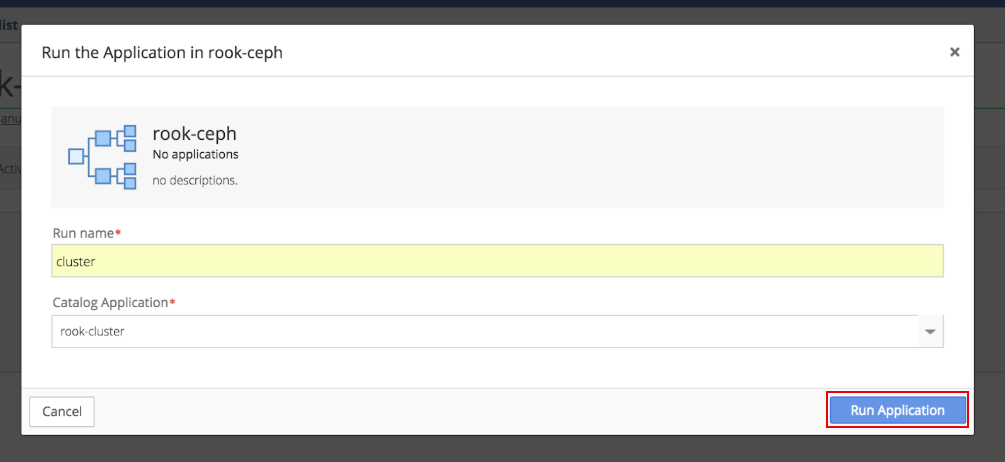
In the Environments menu, open the rook-ceph environment that was just created. Click the gear in the top right corner of the Environments window and select the + Run an Application option.

Choose the rook-cluster application and click Run Application.
Click the gear in the top right corner of the Running Application window and select the Import to Application option.

Import role-bindings into the application.
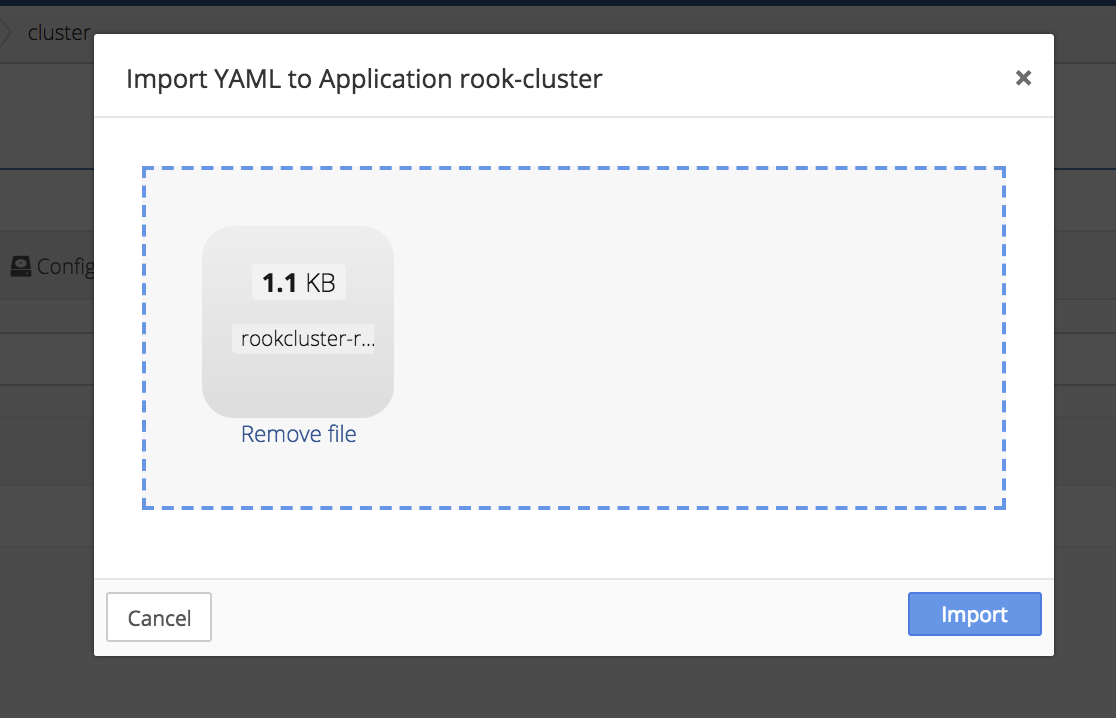
A sample YAML for role-binding Service Account definitions is provided below.
apiVersion: v1
kind: ServiceAccount
metadata:
  name: rook-ceph-cluster
  namespace: rook-ceph
---
kind: Role
apiVersion: rbac.authorization.k8s.io/v1beta1
metadata:
  name: rook-ceph-cluster
  namespace: rook-ceph
rules:
- apiGroups: [""]
  resources: ["configmaps"]
  verbs: [ "get", "list", "watch", "create", "update", "delete" ]
---
# Allow the operator to create resources in this cluster's namespace
kind: RoleBinding
apiVersion: rbac.authorization.k8s.io/v1beta1
metadata:
  name: rook-ceph-cluster-mgmt
  namespace: rook-ceph
roleRef:
  apiGroup: rbac.authorization.k8s.io
  kind: ClusterRole
  name: rook-ceph-cluster-mgmt
subjects:
- kind: ServiceAccount
  name: rook-ceph-system
  namespace: rook-ceph-system
---
# Allow the pods in this namespace to work with configmaps
kind: RoleBinding
apiVersion: rbac.authorization.k8s.io/v1beta1
metadata:
  name: rook-ceph-cluster
  namespace: rook-ceph
roleRef:
  apiGroup: rbac.authorization.k8s.io
  kind: Role
  name: rook-ceph-cluster
subjects:
- kind: ServiceAccount
  name: rook-ceph-cluster
Verify that the mon and mgr pods are deploying.
To verify, check Events and Tasks log or run Kubectl commands from the cluster shell.
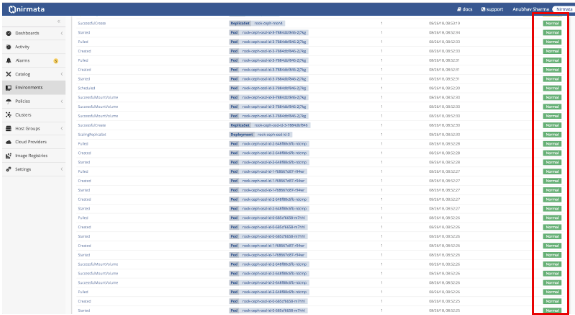
To check Events and Tasks, open the Environment and then open the Activity tab.
Verify that all Environment tasks are reporting �Normal.�
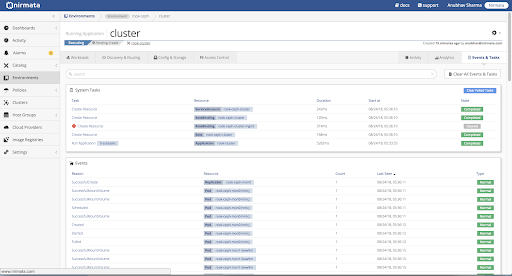
Next, verify Application Events by selecting the Application and opening the Activity tab.
Verify that all Application events are reporting �Normal.�
To run Kubectl commands from the cluster shell, open the Nirmata Cluster Settings menu and select Launch Terminal.

If properly configured, the Kubectl command will report that all pods are running.
